Zoe reporting
The reporting dashboard helps you understand how shoppers interact with Zoe, what they ask, and what outcomes those interactions drive. Use it to spot trends, diagnose friction, and prioritize experience improvements.
This report shows how users use and interact with Zoe: impressions, engagement, ratings etc. If you need to understand purchase impact (conversions, revenue, add to cart) and compare results with and without Zoe, use the Discovery Impact Report. If tracking isn’t set up yet, reach out to Zoovu and we’ll help you enable it.
Navigate the reporting dashboard
Date and global filters
Use the top filters (date, source, locale, device) to scope the entire dashboard. If a chart looks empty, check whether your filters are too narrow.
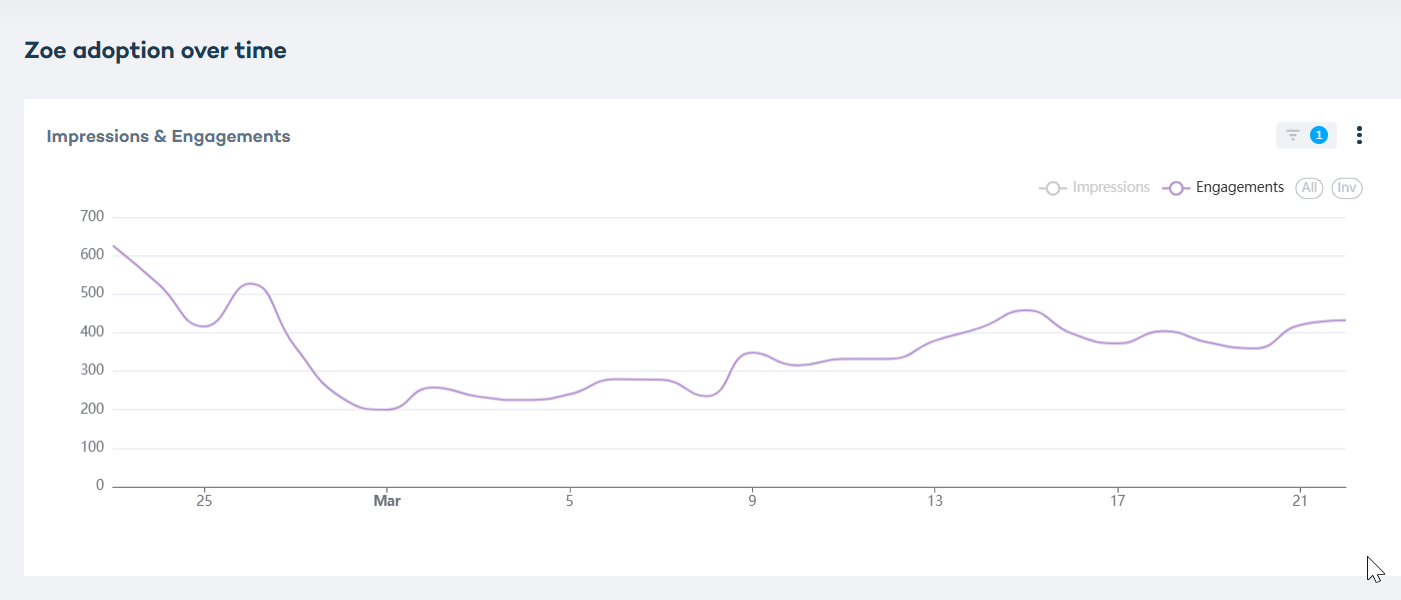
"All" and "Inv" on charts (invert inclusion)
Some charts let you include or exclude subsets of data using All and Inv:
| Metric/Term | Description |
|---|---|
| All | Includes all available values. Use it as a bulk "select everything" action. |
| Inv | Inverts the selection. When inverted, the chart shows data that does not match the selected values. Use it as a bulk "deselect everything" action, then add back only what you want to exclude. |
For example, if you select Mobile and click Inv, you’re effectively viewing everything except Mobile.
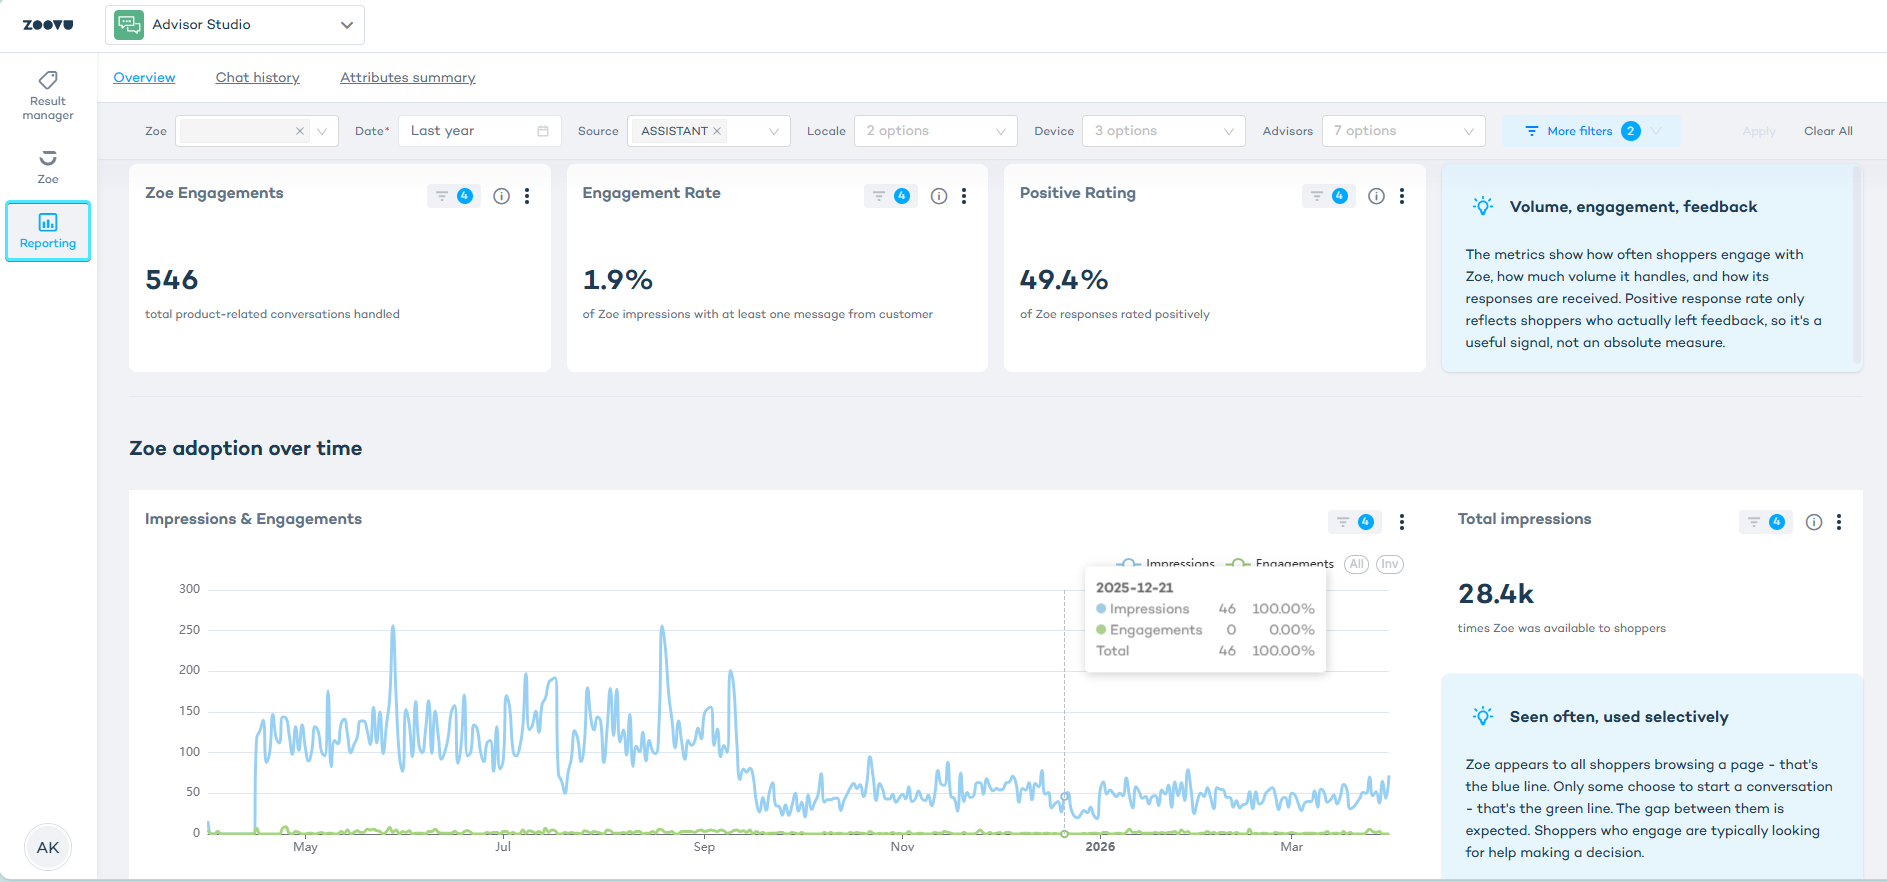
AI conversation performance
This section is the “health check.” It answers: Are shoppers seeing Zoe, using it, and reacting well to its answers?
| Metric/Term | Description |
|---|---|
| Zoe engagements | Total number of product-related conversations handled in the selected period. |
| Engagement rate | Percentage of Zoe impressions with at least one message from the customer. |
| Positive rating | Percentage of Zoe responses rated positively. |
| Zoe adoption over time (impressions & engagements) | Time series showing impressions, meaning the number of times Zoe was available to shoppers, and engagements, meaning the number of times shoppers started interacting. Use it to see whether changes in placement, traffic, or seasonality affect adoption. |
| Usage by device | Breakdown of Zoe usage by device type, for example mobile versus desktop. Zoe responses are the same on all devices, but the widget can look different depending on screen size and placement. Check widget placement and test on desktop and mobile. |
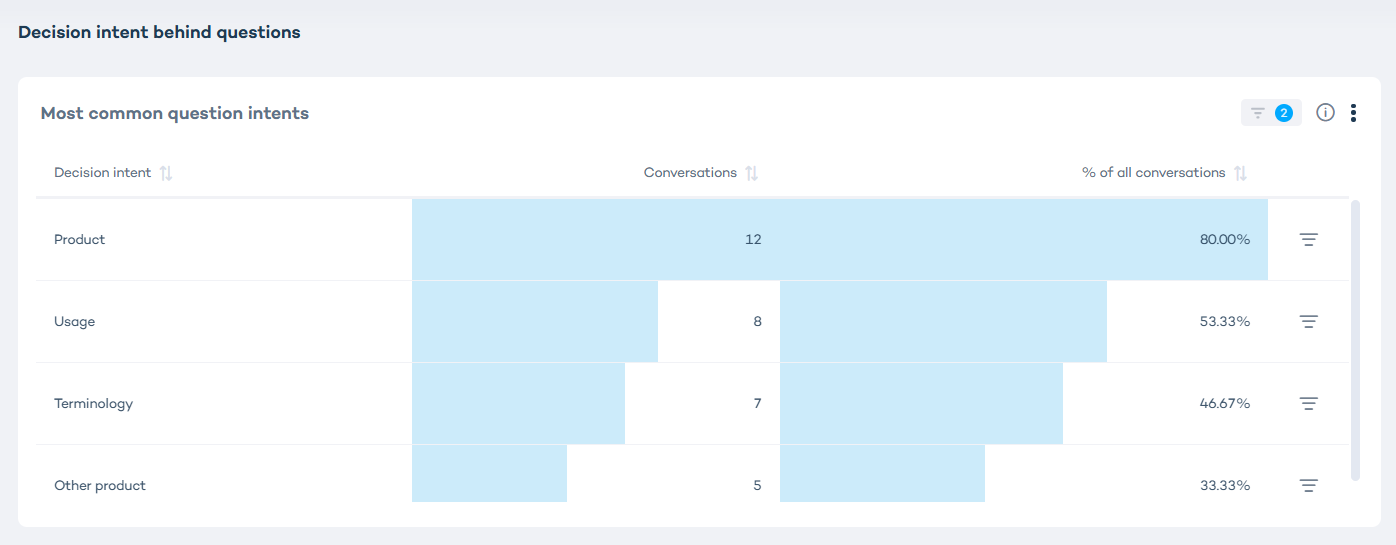
What shoppers ask about most (demand and intent)
This section answers: What are shoppers trying to do, and where do they need help?
| Metric/Term | Description |
|---|---|
| Total questions answered by Zoe | Total number of shopper questions handled across all conversations in the selected period. |
| Avg. questions per conversation | Average number of questions per engaged conversation. |
| Decision intent behind questions (most common question intents) | Distribution of conversations by intent category, for example decision intent, terminology, other product, and usage. |
| Most discussed topics (topics by conversation volume) | Topics ranked by conversation volume in the selected period. |
| Most clicked suggested questions (suggested questions by clicks) | Suggested questions ranked by how often shoppers clicked them to start or steer a conversation. |
| Products supported by Zoe | Count of products that Zoe is set up to support based on your integration and configuration. |
| Avg. conversation duration | Average time spent in engaged conversations. |
In category-based charts, percentages may not add up to 100% because one conversation can belong to multiple categories or topics.
Products discussed with Zoe (product-level engagement)
This section answers: Which products are actually driving Zoe usage?
| Metric | Description |
|---|---|
| Distinct products with Zoe conversations | Number of unique products where shoppers engaged with Zoe during the selected period, based on where the conversation happened rather than on product names Zoe might mention in its replies. This does not represent full catalog coverage. |
Zoe response ratings (sentiment signals)
This section answers: When shoppers choose to rate, what sentiment do we see?
| Metric | Description |
|---|---|
| Total ratings | Total number of ratings submitted for Zoe responses in the selected period. Ratings are voluntary, so low volume does not automatically mean poor performance. |
| Feedback trend over time | Time series of ratings over the selected period. Use it to spot shifts after changes or launches. |
| How to interpret ratings | Negative ratings can be noisy because shoppers sometimes rate a perfectly good answer negatively. Positive ratings are a more reliable signal, which is why a table of positively rated questions is often more useful than the trend line. |
Advanced metrics (assistant integration)
This section applies when Zoe is paired with an Assistant that surfaces product recommendations.
| Metric | Description |
|---|---|
| Zoe-assisted click-through rate | Click-through rate for Zoe and Assistant experiences where Zoe guides the shopper and the Assistant surfaces products. Treat it as a signal of assisted purchase behavior, not direct attribution to Zoe. |
| Revenue referred by Zoe-assisted sessions | Revenue attributed to sessions where Zoe assisted and the Assistant surfaced products. Treat it as an assisted signal, not direct attribution to Zoe alone. |
| Duration | Duration metric tied to the Assistant integration context as shown in the dashboard. Use it as an additional behavioral signal alongside click-through rate and referred revenue. |
All metrics
In the reporting dashboard, hover over the "i" icon next to a metric to read about it without leaving the page.
| Metric/Term | Description |
|---|---|
| Impressions | Number of times Zoe was available to shoppers in the selected period. |
| Engagement rate | Percentage of Zoe impressions with at least one message from the customer. |
| Zoe engagements | Total number of product-related conversations handled in the selected period. |
| Conversations | Number of Zoe conversations in the selected period. |
| Avg. conversation duration | Average time spent in engaged conversations. |
| Positive rating | Percentage of Zoe responses rated positively. Positive ratings are a more reliable signal of helpfulness than negative ones, which can be noisy because shoppers sometimes rate a correct answer negatively. |
| Total ratings | Total number of ratings submitted for Zoe responses in the selected period. Ratings are voluntary, so low volume doesn't automatically mean poor performance. |
| Feedback trend over time | Time series of positive and negative ratings over the selected period. |
| Avg. questions per conversation | Average number of questions asked per engaged conversation. |
| Total questions answered by Zoe | Total number of shopper questions handled across all conversations in the selected period. |
| Decision intent behind questions (most common question intents) | Distribution of conversations by intent category, for example decision intent, terminology, other product, and usage. Shows what shoppers were trying to accomplish. |
| Most discussed topics (topics by conversation volume) | Topics ranked by conversation volume in the selected period. Requires at least 100 Zoe messages to populate. |
| Most clicked suggested questions (suggested questions by clicks) | Suggested questions ranked by how often shoppers clicked them to start or steer a conversation. |
| Products supported by Zoe | Count of products Zoe is configured to support (based on your integration and available product data). Not a performance metric. |
| Distinct products with Zoe conversations | Number of unique products where shoppers engaged with Zoe during the selected period. Based on where conversations happened, not on product names mentioned in Zoe's replies. Does not represent full catalog coverage. |
| Usage by device | Breakdown of Zoe usage by device type (for example, mobile vs desktop). Zoe's responses are the same on all devices, but the widget can look different depending on screen size and placement. |
| Zoe adoption over time (impressions & engagements) | Time series showing impressions and engagements in the selected period so you can track adoption changes over time. |
| Zoe-assisted click-through rate | Click-through rate for sessions where Zoe assisted the shopper. Treat as a signal of assisted purchase behavior, not direct attribution to Zoe. |
| Revenue referred by Zoe-assisted sessions | Revenue attributed to sessions where Zoe assisted the shopper. Treat as an assisted signal, not direct attribution to Zoe alone. |
| Duration | Duration metric shown in the Assistant integration context. Use it as an additional behavioral signal alongside click-through rate and referred revenue. |
In a third-party environment (syndication), Zoe tracks chat history and feedback. Revenue-related metrics are not available because transactions happen outside the Zoovu platform.
Metrics by use case
| Use case | Metrics |
|---|---|
| Adoption issues (visibility/placement) | Check impressions, Zoe engagements, engagement rate, and usage by device. |
| Question demand and content gaps | Check total questions answered by Zoe, most discussed topics, and decision intent behind questions. |
| Depth of help needed | Check avg. questions per conversation and avg. conversation duration. |
| Quality signals | Check positive rating, total ratings, and feedback trend over time. |
| Downstream outcomes (if integrated) | Check Zoe-assisted click-through rate and revenue referred by Zoe-assisted sessions. |